
In this activity, we learn how to segment images into objects containing particular characteristic, in this activity, let’s do colors.
So let’s begin with something basic, grayscale images.
Let’s look at this particular image of a very funny check.
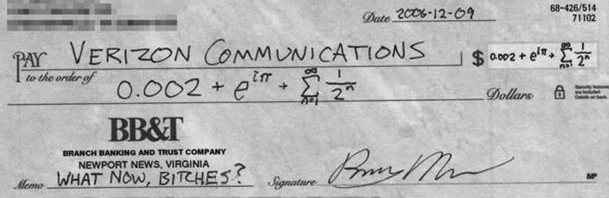
It’s so funny though.
If we look at the image, the gray background is not really useful. let’s fix this by binarizing the image. We’ll set a threshold. any pixel above this threshold level will be 0 and below is 1. so let’s try this

Threshold = 100. We see most of the details. But some details, like the signature, are lost.

Threshold = 144. We see most of the details clearly.
Threshold = 200. the image is too filled with white
that was easy enough. obviously, segmenting is a matter of setting the optimal threshold. but how can you find the optimal threshold at all.
well, you can just find the background pixel value. let’s look at the histogram of the image.
So the last of the background seems to be somewhere around 170.
We take a segmented image near that

A lot more detail is visible now. The letters at the bottom-right corner are readable again
COLOR SEGMENTATION
Now let’s look at something trickier: real colored images. I thought of doing something fun. Like m&m’s.
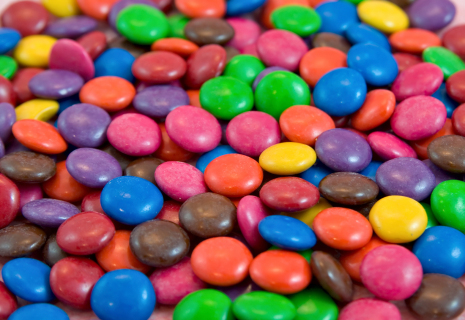
Let’s say a certain internet monster, Bernie, only eats blue m&m’s. But a mean troll traps him and will only let him eat the blue m&m’s if Bernie can say how many there are in the picture. The problem is, Bernie has poor eyesight. Colors begin blurring around. Individually, he can distinguish blue m&m’s but they become hidden in the image. How can we help our poor friend?

This is Bernie
Well there are two ways by which we do this. The parametric, and the non-parametric segmentation method.
But here’s a problem. Graylevel segmentation works with a threshold over a single variable. Color, as humans perceive it is trichromatic. That is, color is composed of three components. It’s commonly Red Green and Blue. So how do we determine if a pixel value is the same color? since there are three channels, setting a threshold value for all three becomes hard and very difficult. Let’s see if it can be simplified.
We’ll come back to the segmentation part. Since the problem of the material is 3 channels (all of which vary from pixel to pixel due to intensity brightness). we’ll do chromacity.
Let’s say a pixel has R, G and B values. We say the intensity, I, of the pixel is I = R+G+B. We say the chromacity r = R/I as well as g = G/I. Consequently, b = B/I = 1 – r -g, so it isn’t independent anymore. We can define any color only using r and g.
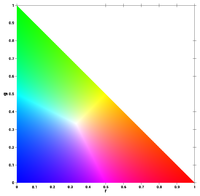
Well, you see most colors and you can represent blue without taking the chromacity of blue. Image Source: Wikipedia
So the 3-color problem is now a 2D problem.Seems easy enough. Let’s get back to Bernie’s dilemma.
Bernie can see the Blue m&m’s in the front. So he hopes to just use a quick bit of programming to find the other blue m&m’s. He takes one of the obviously blue m&m’s and studies the color.

(This photo is already zoomed in)You see that there are different shades of blue with varying values of R, G and B due to varying intensities.
So using we use this region first. We assume that this small Region Of Interest(ROI) contains, more or less, all shades of blue. We go back to something I said earlier the parametric and non-parametric methods.
Parametric
The parametric method basically means solving the probability that each pixel is the same color as the ROI. So for this we take μ (mean value) σ (standard deviation) in r and g of the ROI.
Then solve for the probability
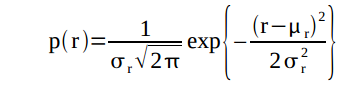
and the same for g. The probability the pixel is the same color as the ROI is then the product of the two probabilities.
Bernie does this and comes up with
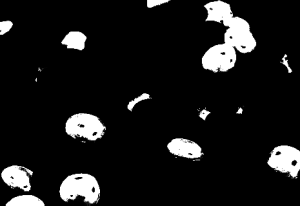
even barely visible blue m&m’s become apparent now.
Non-parametric
Well, something easier. instead of solving probabilities(that the computer still has to round out to assign discrete RGB values to). We make a histogram of the chromacity space. therefore, with larger images, we can just look up the histogram and not have to calculate so many joint probabilities.
Bernie also does this (just to be sure) histogram

If you look at the normalized chromacity coordinates. It’s in the blue region.
And using this histogram Bernie got
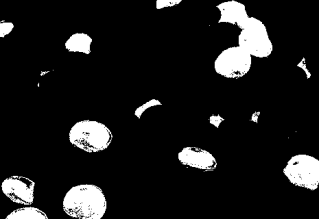
they’re more pronounced now
So Bernie guesses right. and is able to get all the blue m&m’s he can eat.
Acknowledgements:
I would like to thank Carlo Solibet, who was nearest to me and noticed the one bug in my code that wouldn’t let me find the histogram.
I would give myself 10/10. because this activity was easy enough to do.
